Photography Agent (Fall 2025)
The Photography Agent is a collaborative semester project focused on building a photo organization and editing system powered by an agentic large language model (LLM). The LLM interprets natural language user requests and calls specialized computer vision tools for photo filtering and editing.
LLM Agent (Primary Contribution)
- Base of Llama-3-8B-Instruct
- Fine-tuned using LoRA on 1,985 curated examples
- Trained to:
- Generate valid JSON tool-call outputs
- Select appropriate tools based on user intent
- Respond naturally when no tool invocation is required
- Explain available tools when requested
- Handle ambiguous or invalid requests appropriately
- Designed and iteratively refined a custom system prompt, where prompt engineering was crucial to improving response consistency, reducing hallucinations, and enforcing structured outputs.
- Evaluated using a held-out, shuffled test set of 218 examples.
- Achieved 88% overall response accuracy across tool selection and conversational tasks.
System Tools (Team Contributions)
- Focus tool: return blurry or non-blurry images
- Exposure tool: return properly exposed, underexposed, or overexposed images
- Color tool: return images with warm, cool, or neutral color tones
- Album filtering tool: return images that match a specified topic
- Background blur tool: apply background blur to selected images
- Object removal tool: remove people or vehicles from selected images
Links
Demo of Photography Agent (link)
Diabetic Retinopathy Classification Preprocessing Evaluation (Spring 2024)
In this project, a partner and I investigated the impact of image preprocessing techniques on diabetic retinopathy (DR) severity classification using deep learning models, with the goal of determining whether a single preprocessing strategy generalizes across architectures.
- Fine-tuned and evaluated ResNet-50, EfficientNet, and a hybrid DenseNet–Swin Transformer (DenseSwin) on a dataset created from the APTOS 2019 and EyePACS retinal fundus datasets.
- Compared five preprocessing pipelines, including CLAHE-based contrast enhancement, histogram equalization, Gaussian subtractive normalization, and a baseline preprocessing.
My Contributions
- Implemented and fine-tuned EfficientNet and DenseNet-based (DenseSwin) models.
- Implemented retinal image preprocessing pipelines, including Gaussian Subtractive Normalization, CLAHE on the green channel with median filtering, and standard preprocessing.
- Performed quantitative evaluation and result visualization, including accuracy, precision, recall, and F1 score comparisons across models and preprocessing methods.
Results
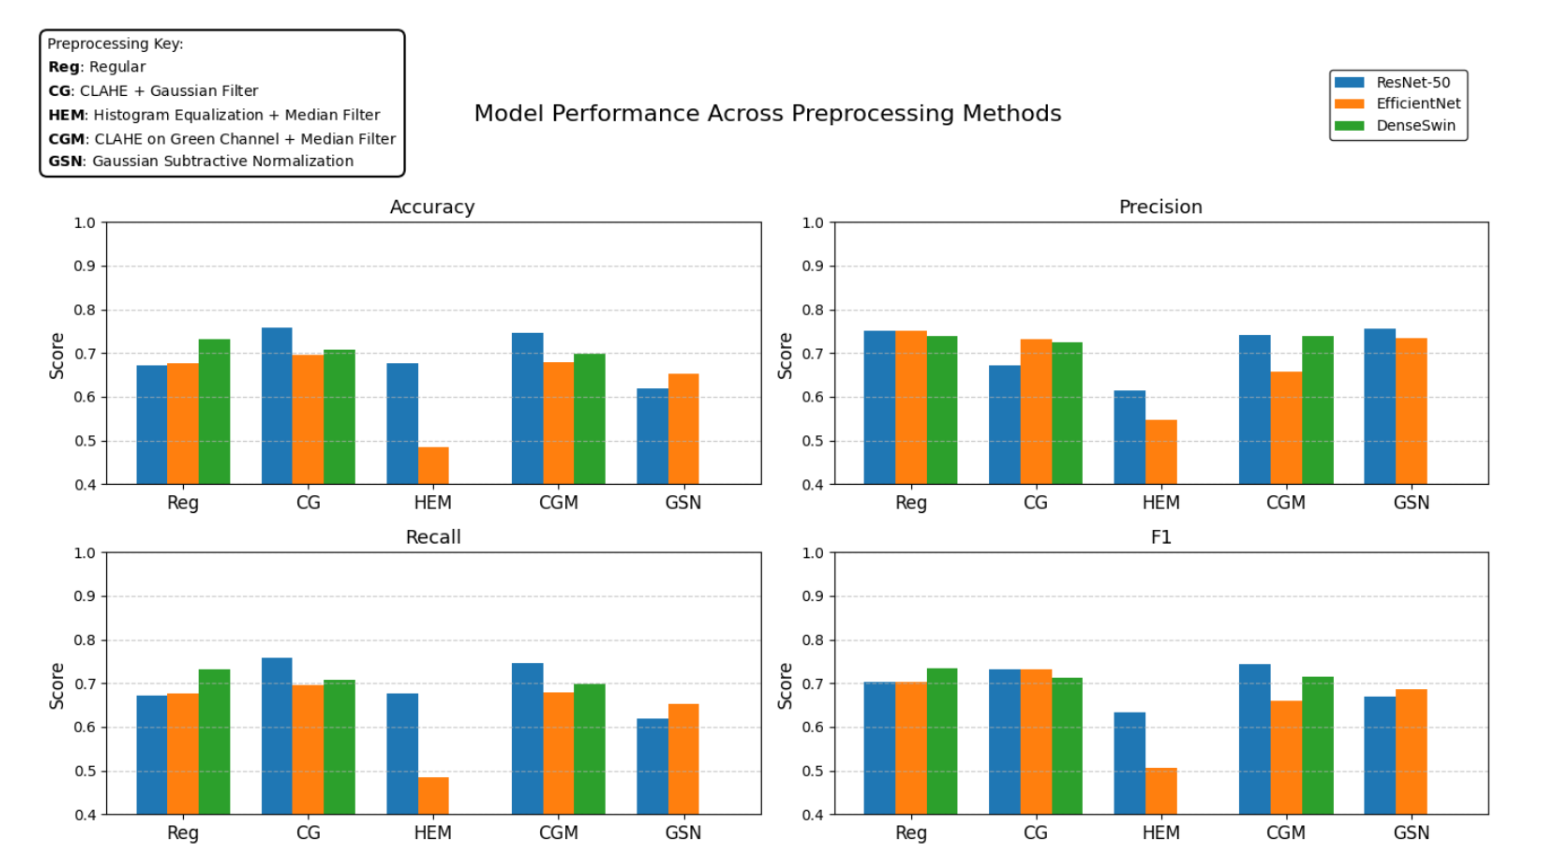
- All three models were evaluated using accuracy, precision, recall, and F1-score across five preprocessing pipelines.
- CLAHE + Gaussian filtering yielded the largest performance gains for ResNet-50 and EfficientNet relative to baseline preprocessing.
- The DenseSwin model achieved its highest metrics using standard preprocessing.
Key Findings
- Preprocessing effectiveness is architecture-dependent; contrast enhancement techniques improved CNN-based models (ResNet-50, EfficientNet), while the hybrid DenseSwin model achieved optimal performance with standard preprocessing.
- No single preprocessing pipeline generalized best across all architectures, highlighting the need for joint optimization of model and input pipeline.
Links
Cell Type & Cancer Classification (Fall 2024)
This project applies deep learning to automated cell-type and cancer multi-classification using the CellNet medical imaging dataset. The models classify images into 19 cell types and distinguish benign cells from multiple cancer subtypes, with the goal of improving speed and reliability in medical image analysis.
- Fine-tuned and evaluated 4 models(ResNet, EfficientNet, Multilayer Perceptron (MLP), and Swin transformer) using the CellNet dataset.
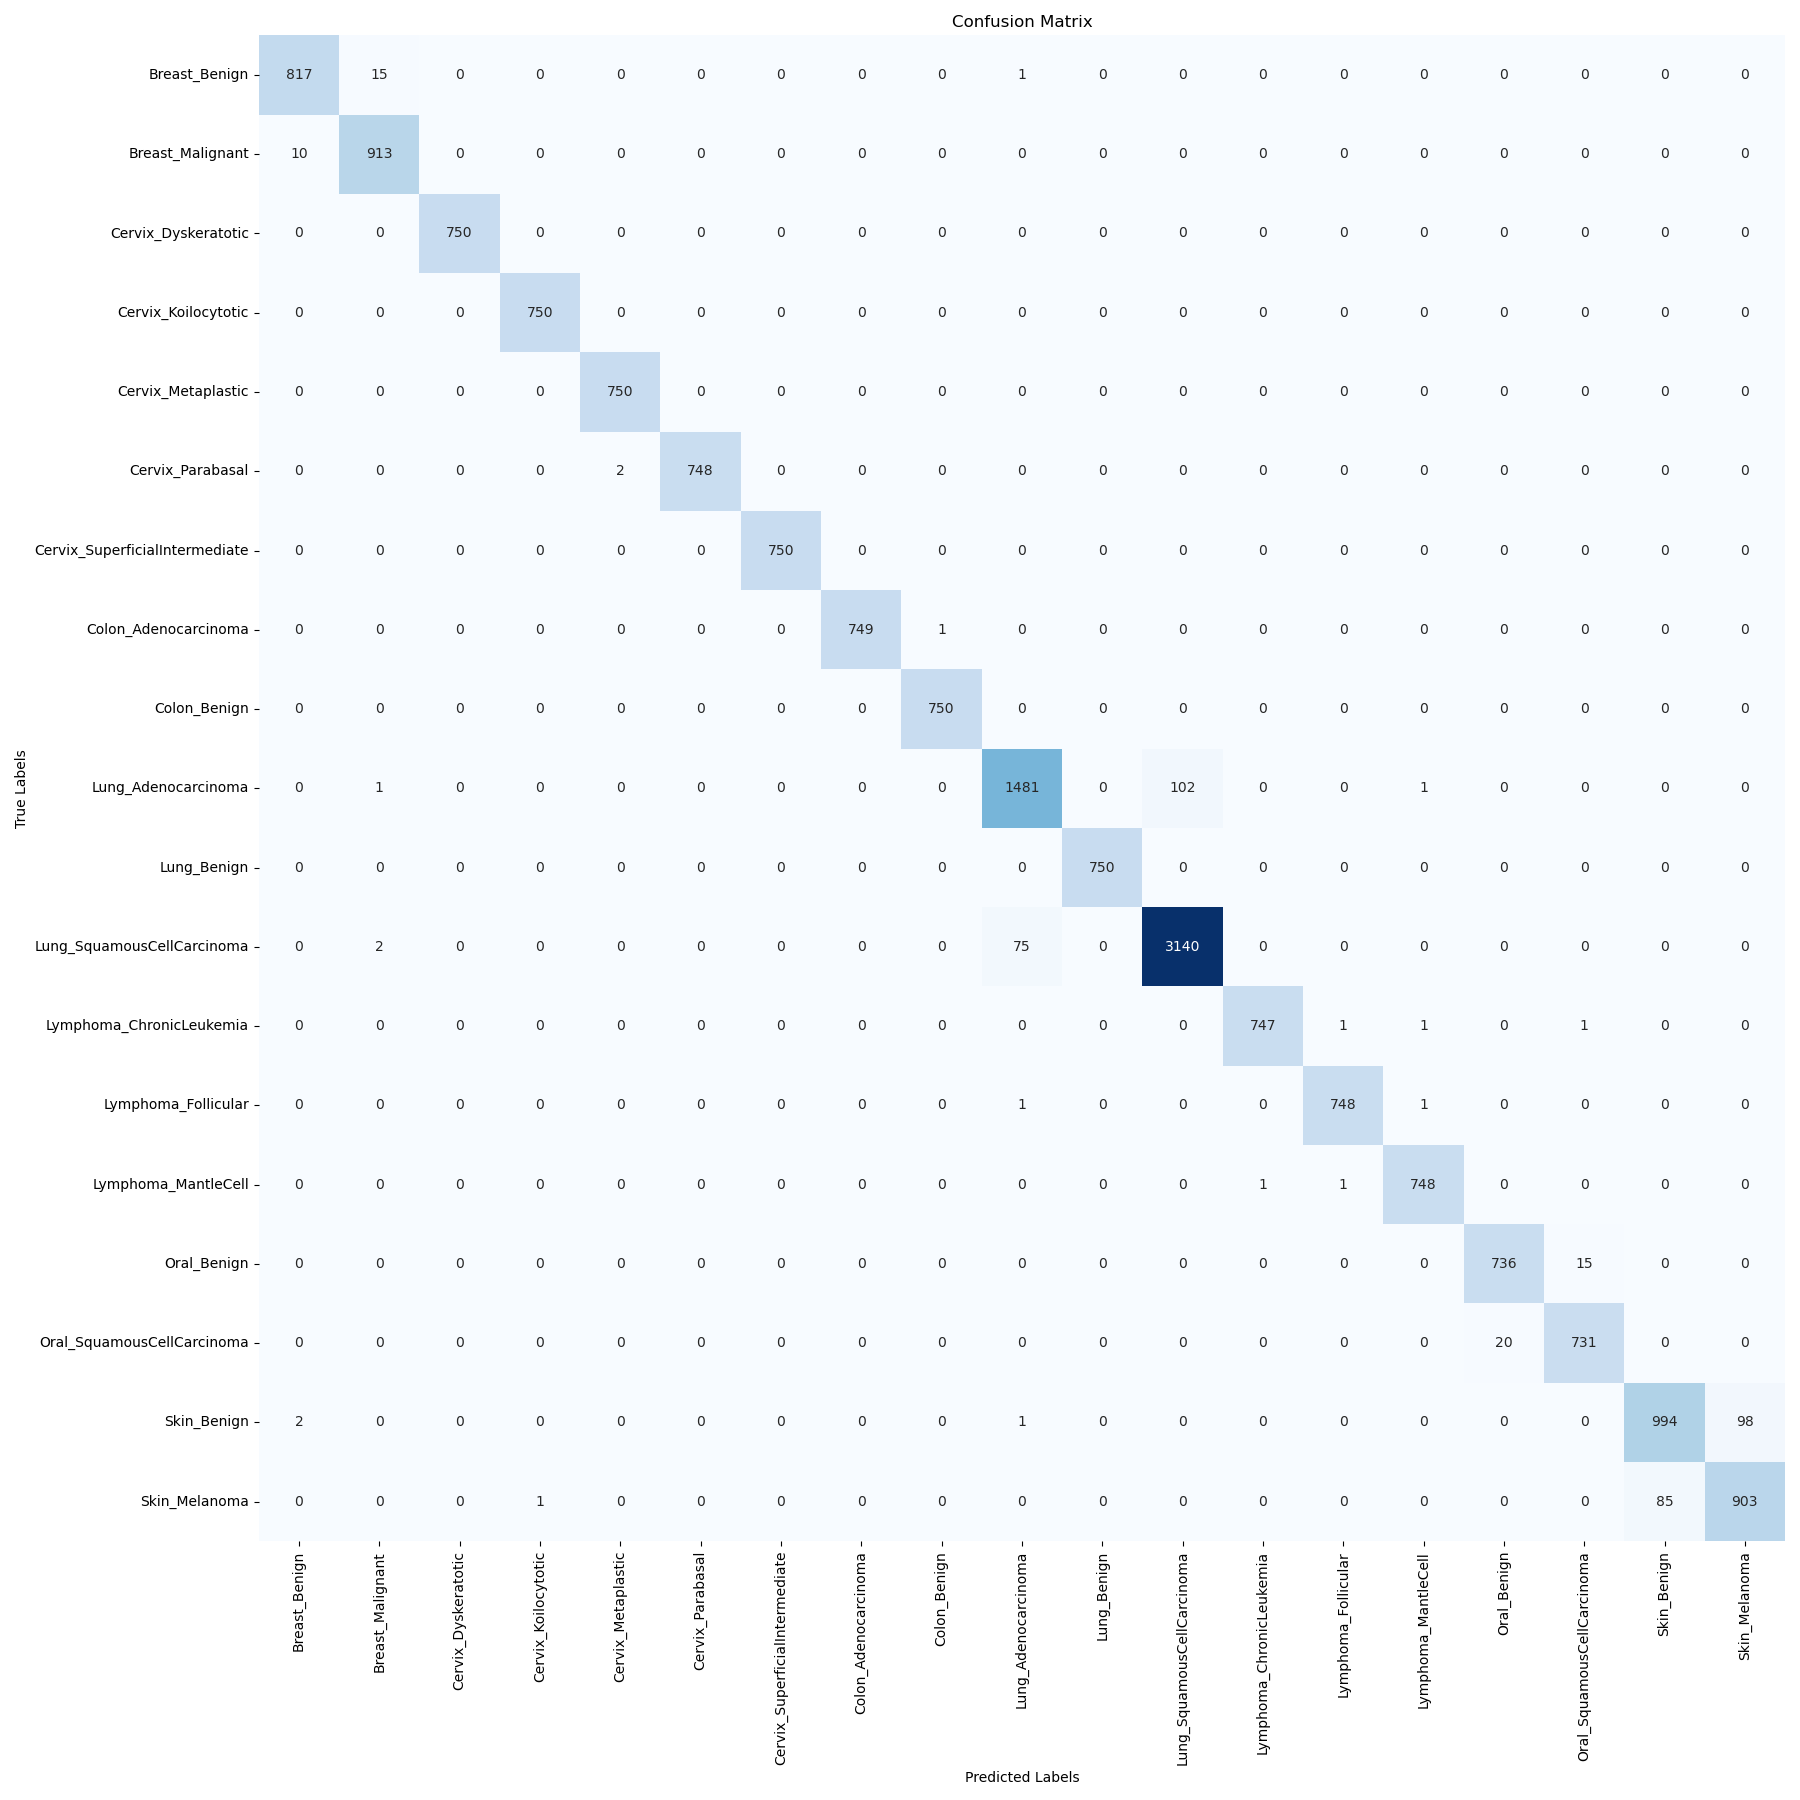
- Evaluated models using test accuracy, weighted F1-score, and confusion matrices.
Swin Transformer (Primary Contribution)
- Implemented a hierarchical Swin Transformer for large-scale medical image classification.
- Explored architectural trade-offs to reduce compute without sacrificing accuracy.
- Performed a grid search to optimize hyperparameters, including learning rate, batch size, and MLP ratio.
Results
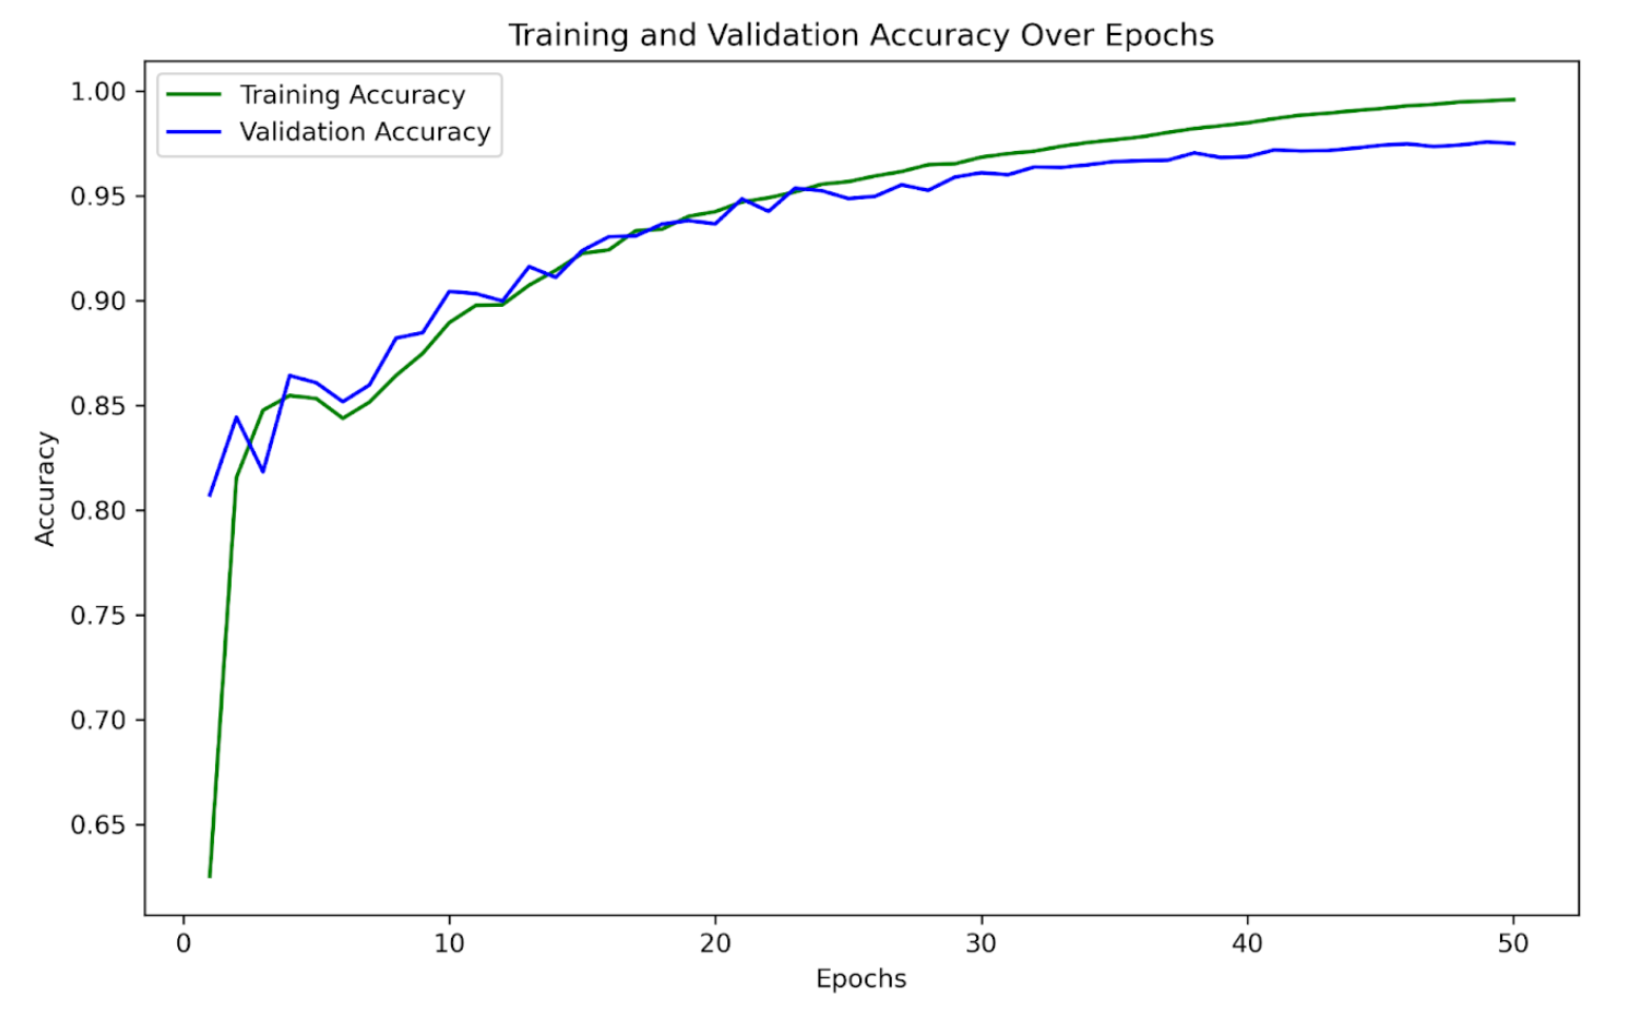
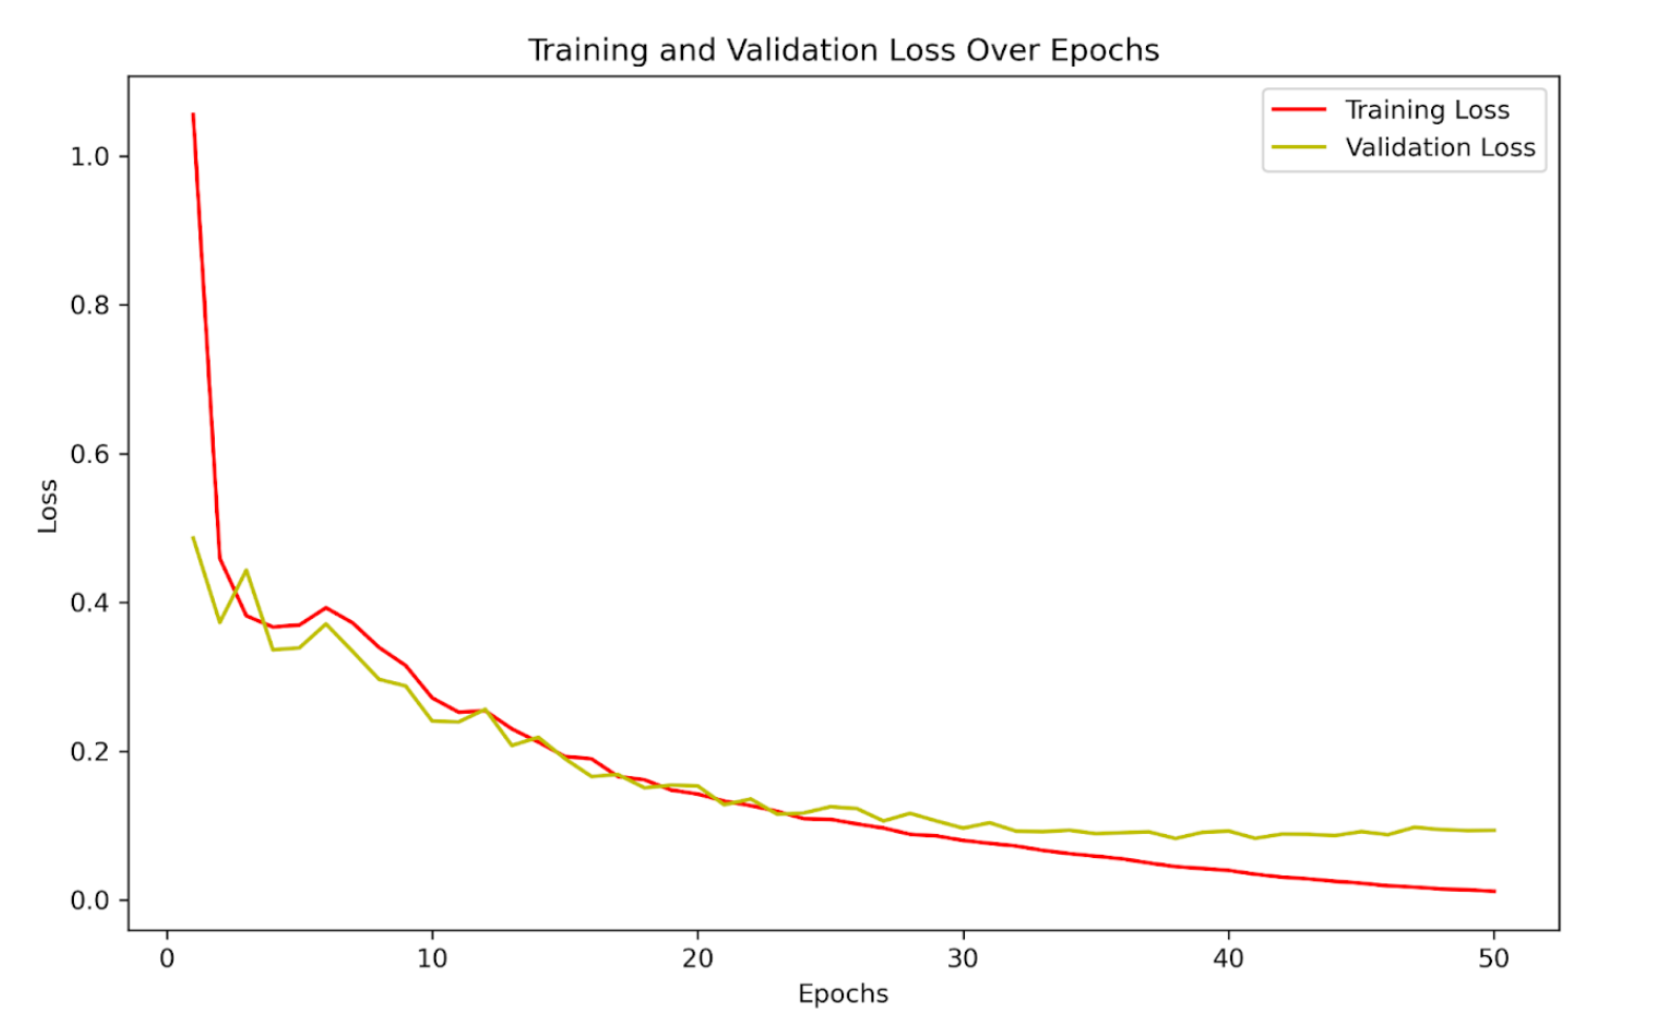
- Test Accuracy: 97.6%
- Weighted F1 Score: 0.976
Baseline Models (Team Contributions)
- ResNet50: Served as a strong convolutional baseline, achieving 83.9% test accuracy and a weighted F1 score of 0.826.
- EfficientNet: Reached moderate test accuracy but exhibited severe class imbalance, resulting in a very low weighted F1 score.
- Multilayer Perceptron (MLP): Functioned as a non-convolutional baseline and struggled to scale to high-dimensional, multi-class image data.
View detailed results for baseline models (ResNet, EfficientNet, MLP)
The following models were evaluated during development but underperformed relative to the Swin Transformer in both weighted F1-score and convergence.
EfficientNet
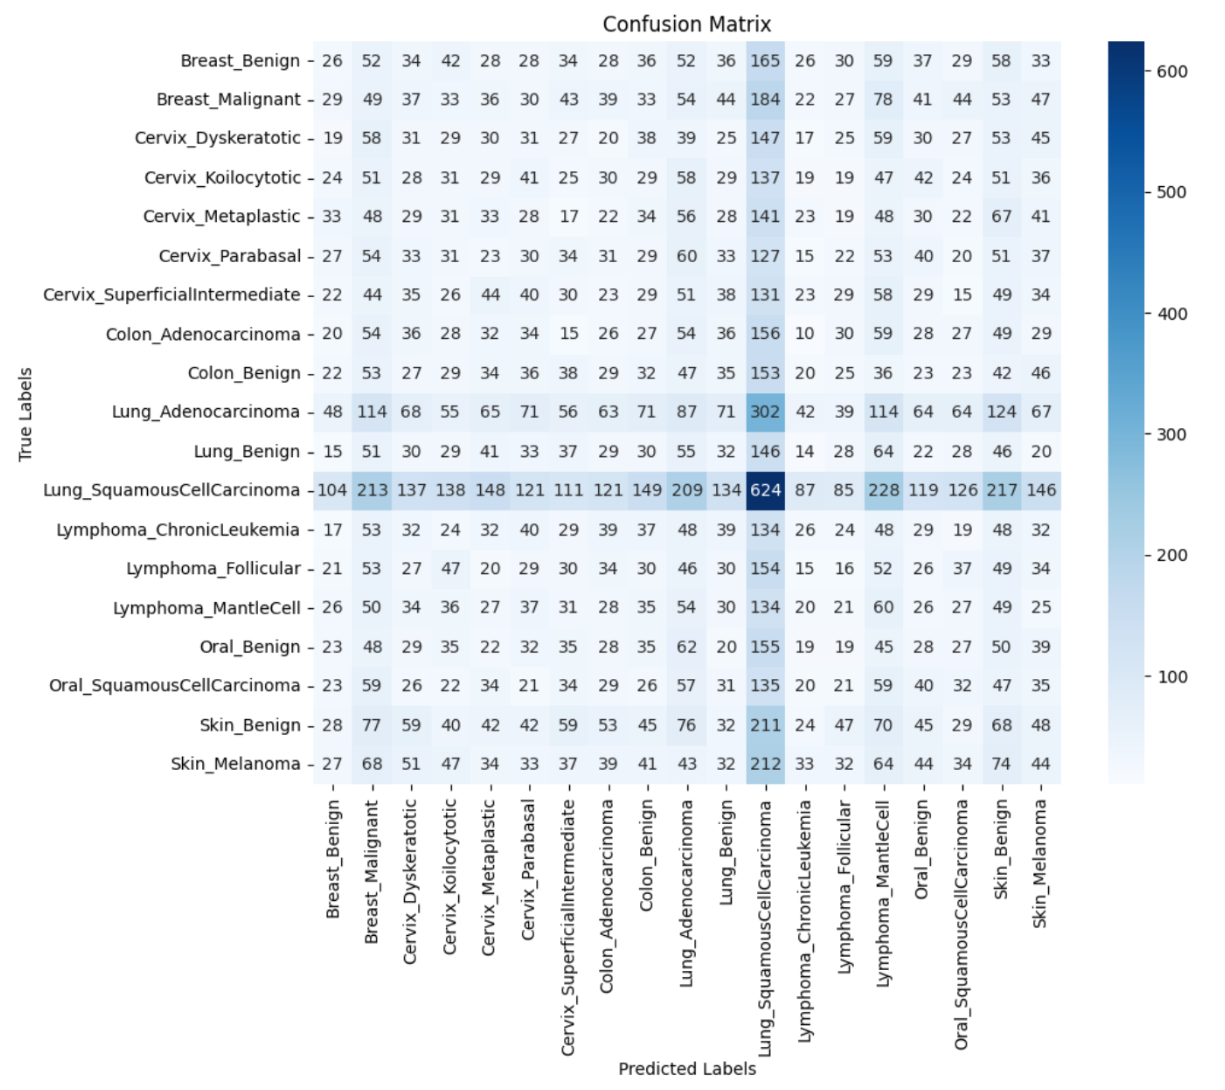
- Achieved a test accuracy of 80.2%, but a very low weighted F1 score of 0.069, indicating strong class imbalance effects and poor per-class performance.
- The confusion matrix reveals extensive misclassification across classes, including a strong bias toward the dominant class as well as a high number of false negatives within the majority class itself, indicating poor class separation overall.
Multilayer Perceptron
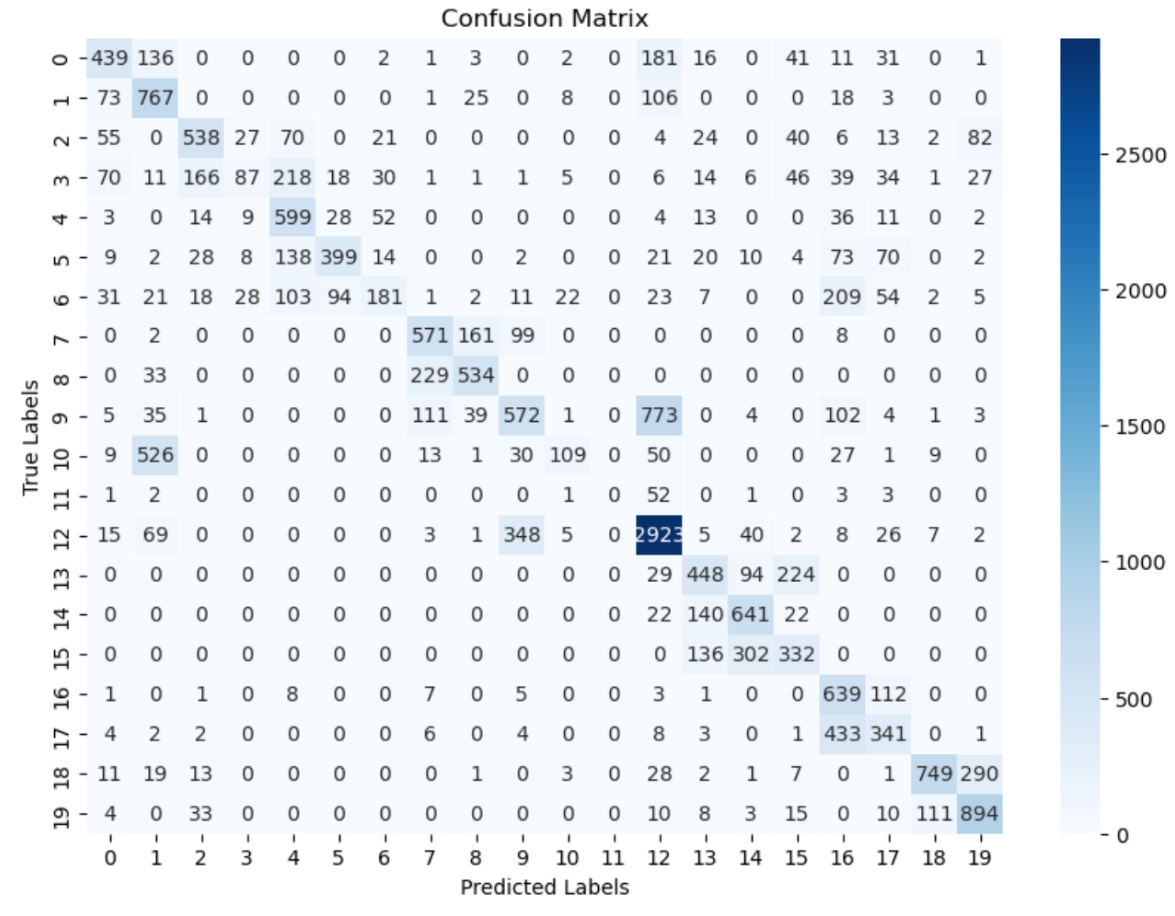
- Achieved a test accuracy of 49.0% with a weighted F1 score of 0.576, indicating limited overall performance but improved class-level balance compared to EfficientNet.
- The confusion matrix shows greater concentration along the diagonal than EfficientNet, suggesting better handling of class imbalance, though a substantial number of false positives and false negatives remain.
ResNet50
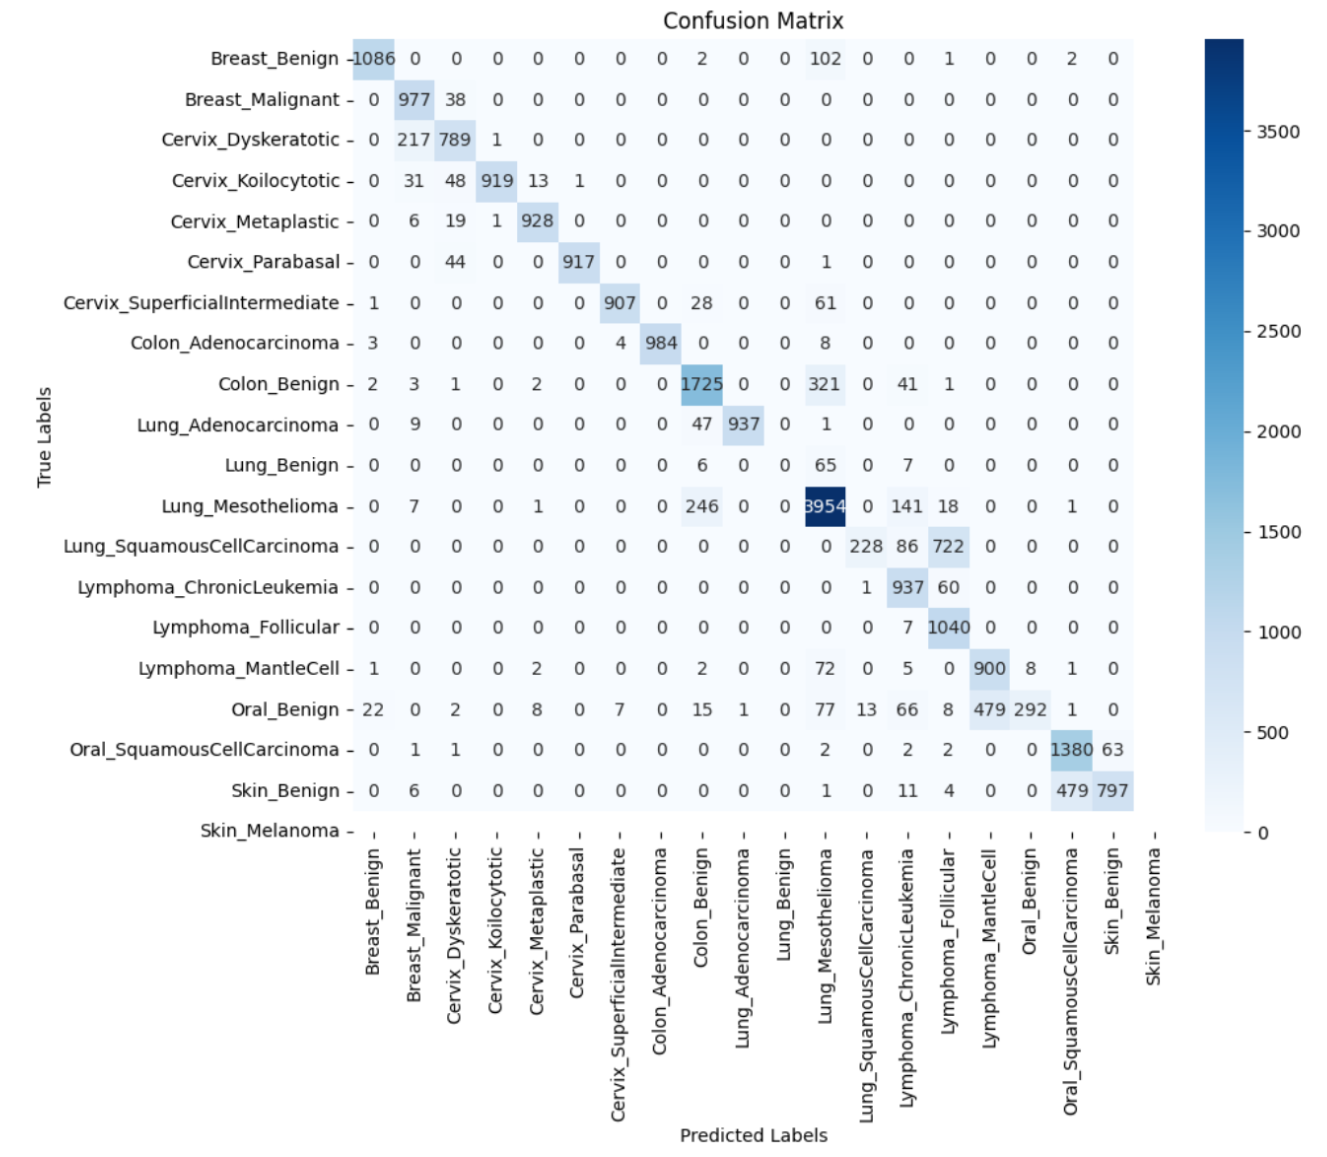
- Achieved a test accuracy of 83.9% and a weighted F1 score of 0.826, demonstrating improved performance over EfficientNet and MLP.
- The confusion matrix exhibits strong diagonal alignment, with most errors concentrated between visually similar classes (e.g., skin_benign vs. skin_melanoma), suggesting remaining challenges in fine-grained visual discrimination.
Key Findings
- Swin Transformer achieved the best overall performance, significantly outperforming all baseline models.
- Hierarchical attention enabled effective modeling of complex and visually similar cell types.
- Weighted F1-score confirmed consistent performance across imbalanced cancer classes.
- The findings support Swin Transformers as a compelling architecture for medical imaging applications.